Brain Tumor Estimation – Mixed Reality
Collaborator: M. ABDUL GAFOOR
Supervisor: M. PREDA
A pipeline composed of tumor detection in human brain using deep learning and visualization using Mixed Reality(MR) technology.
Table of contents
Problematic
The recent advancement in processing power of computers have enabled tremendous opportunities for the increased use of virtual reality (VR) and augmented reality (AR) technology in medicine and surgery. The visualization of human organs in the 3D environment takes a central role in the procedure of diagnosis and the follow up treatment of any disease. An automated immersive visualization of a human brain from a sequence of 2D MRI images in the MR environment is necessary not only to detect and classify the nature of tumors but also it helps surgeons to approach the tumor from a virtual perspective and to plan a possible surgery ahead of time. In this work, we adapt an approach for a possible immersive visualization of the human brain in the VR environment and consequently propose the best two possible tumor locations using U-Net deep learning framework.
Research aim
The aim of this research work is to develop a tool for an immersive visualization of human brain tumors in the MR environment in order to facilitate the surgical procedures.
-
Analyze MRI data using a 3D-point-cloud-generation.
-
Integrate a state of the art Deep Learning framework, known as U-Net with the MR application in order to detect the potential brain tumor location => A well-trained DL model, the nature of malignancy (Benign/Malignant) & location of the tumor (Vector 3).
-
Building an MR tool for brain surgeons in order to have an immersive visualization before participating in a real surgical environment => .exe application.
Dataset
Data Description (difficulties & importance for such a project) We have studied many datasets for the purpose of this project. For example, RIDER Neuro MRI contains imaging data that we have obtained from The Cancer Imaging Archive (TCIA) [1]. However, the dataset is not good for the immersive visualization or it does not contain annotated information. This is an issue we faced at the start of this project, because choosing a correct dataset is very important for the success of this project. Hence, we have decided to go to Multimodal Brain Tumor Segmentation Challenge 2020 data. This data contains a train & validation set. All the scans are available as NIfTI files (.nii.gz) and describe as native (T1), post-contrast T1-weighted (T1Gd), T2-weighted (T2), T2 Fluid Attenuated Inversion Recovery (T2-FLAIR) volumes and were acquired with different clinical protocols and various scanners from multiple (n=19) institutions, mentioned as data contributors here [2]. All the dataset have been segmented manually, by 1 to 4 raters using a standard protocol and it was then validated by experienced neuro-radiologists.
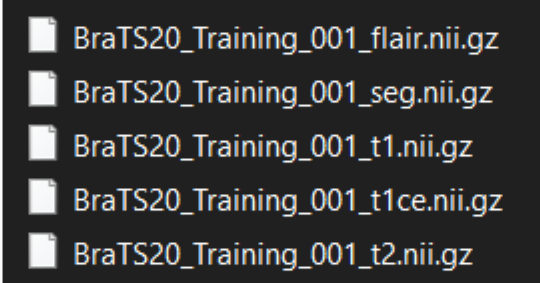
The following figure is a typical folder structure, where you can see the segmentation data, which is our label data.
However, segmentation information is not available in the validation dataset. But we have to predict the possible tumor location.
Data format
All the images are in NIfTI files (.nii.gz). If we want to visualize these in the Unity environment, we have to convert it to DICOM format. So we have used a 3D slicer tool to convert all the .nii files to DICOM format that are ready to upload in the Unity.
Deep learning
In this project we use a state of the art architecture for biomedical segmentation known as U-Net. It was developed at the Computer Science Department of the University of Freiburg, Germany.
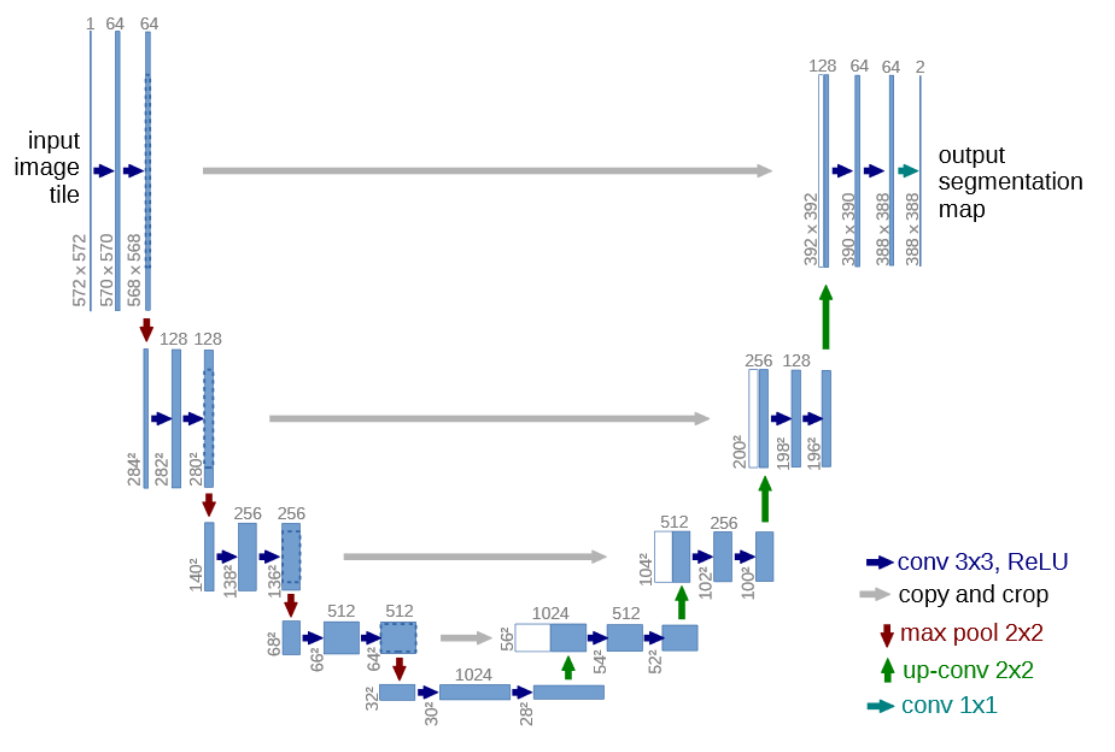
U-net architecture (example for 32x32 pixels in the lowest resolution). Each blue box corresponds to a multi-channel feature map. The number of channels is denoted on top of the box. The x-y-size is provided at the lower left edge of the box. White boxes represent copied feature maps. The arrows denote the different operations [3].
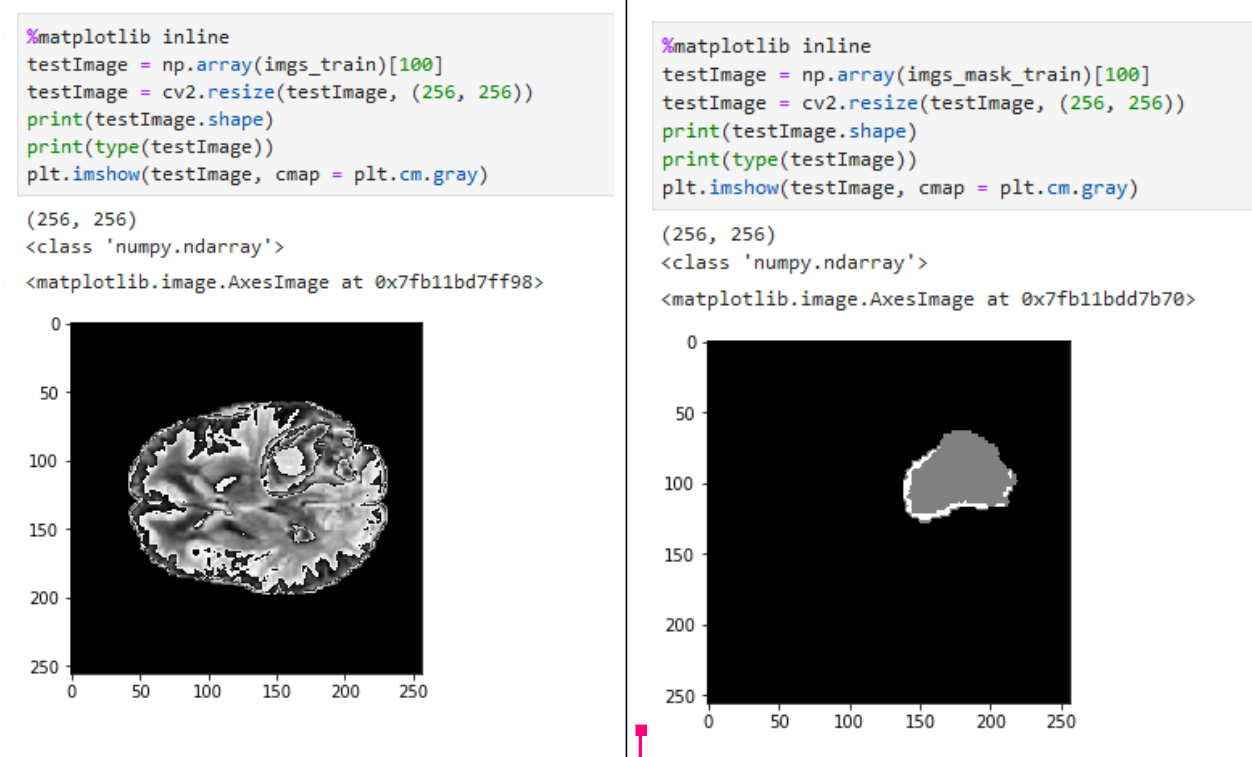
Before feeding into the network, we must make sure the data is in an appropriate shape and format. We wrote a function that takes the data and separates the training_masks and training_images. We resize all the images to 256x256.
All the data that we have prepared have been saved in .npy file format. Because we don’t have to re-run the function again to prepare the train data and the mask data. The following is a screen-shot of a training image and the corresponding tumor location.
As a backbone of the model we use resnet34. And set the input_shape to (256, 256, 1).`
Visualization
Volume rendering of sliced images
According to the research, the volume rendering will be the most suitable solution for visualization. By definition, volume rendering is a set of techniques used to display a 2D projection of a 3D discretely sampled data set. A typical 3D data set is a group of 2D slice images acquired by a CT, MRI scanner.[1] Imagine each slice of the brain as a plane, and the task of volume rendering will be putting the planes side by side. In this case, each pixel onto a plane will have a 3d coordinate and will be rendered according to the gray value of it.
There are two main toolkit providing frameworks for volume rendering, which are OpenGL and VTK separately. We found some tutorials on volume rendering within python. However, we have some constraints:
- VTK’s plugin named Activiz including complete features which can be found in Unity’s asset store is quite expensive. We cannot build a solution based on it.
- Volume rendering is only a visualization. It is not easy to export like a model the rendering result into Unity. However, we need Unity to navigate and interact inside the volume rendering output.
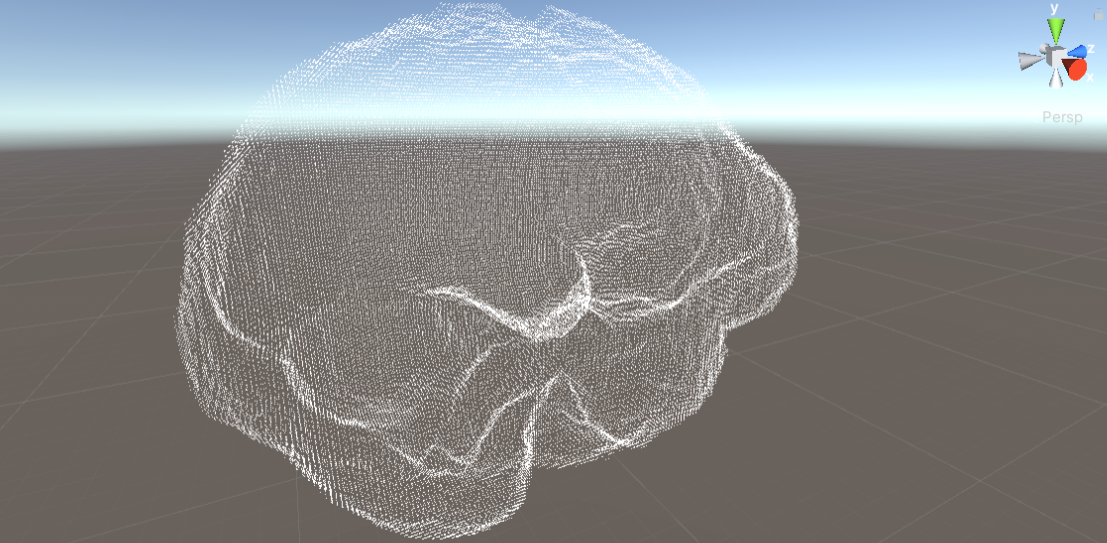
We did some tests on another idea: transferring data as point cloud and importing it into Unity. We used vtk inside the Python environment to convert the data format, and successfully generated a point cloud file. However, the point cloud file only contains the surface of the brain data. In order words, we lose all the structure inside the brain. The image below is the point cloud file of our train data.
Based on these constraints, we decided to use Unity as the visualization module, by searching for some other plugins that use Unity’s shader to implement the volume rendering.
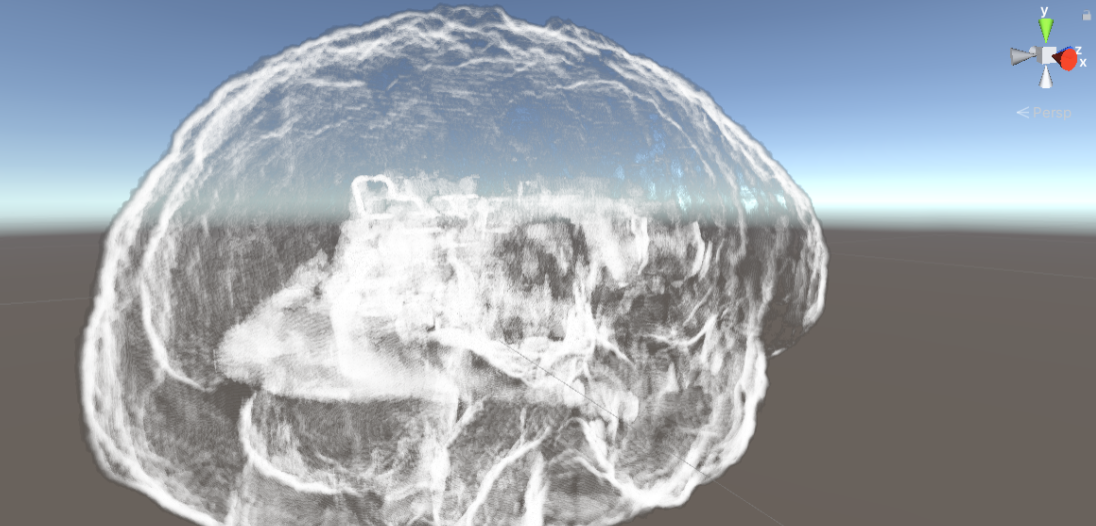
For the final solution, we use an implementation of volume rendering that can be found [here][4]. The renderer fulfills our requirements on adjustment on transparency of voxels. What we need to import in is the path to the dicom folder. As we can see below, the internal structure is visible by using this renderer.
k3d widget to visualize 3d data on webpage
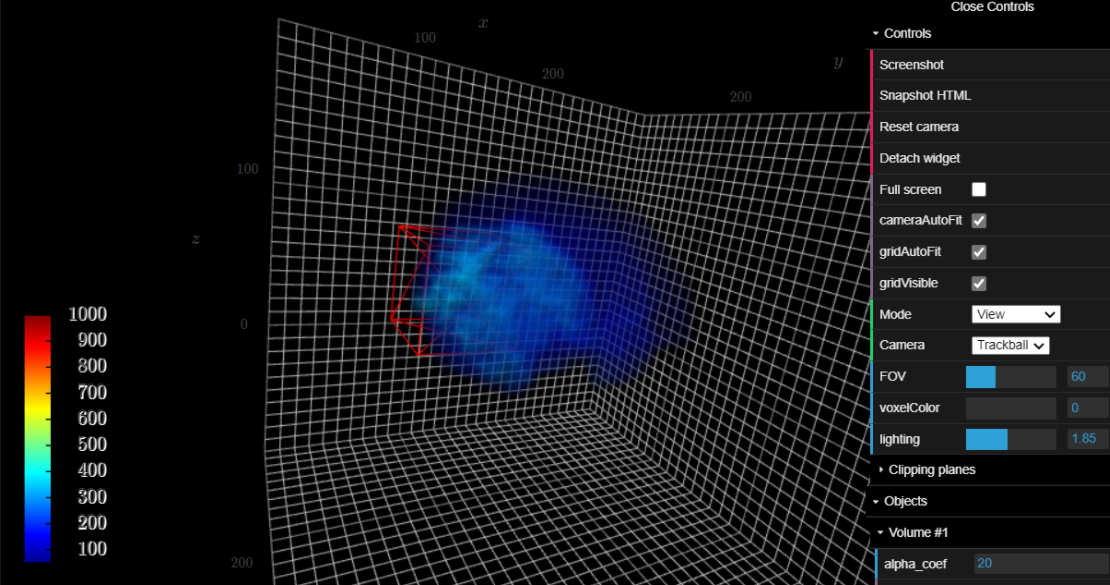
We did some other experiment to know whether it is possible to handle the visualization and interaction inside python. A discovery is K3D Jupyter widget, which is a Jupyter notebook extension for 3D visualization. We can make some basic interactions like rotation, and adjustment of scale.
The image below shows the brain from training data. K3D Jupyter will colorize it automatically according to the value of the voxel. The red box indicates the position and size of the tumor. It is convenient to visualize it inside on a webpage, but the interaction choices are limited. Besides, it is hard to find a virtual reality package working in a python environment. We did not continue onto this path further.
MRTK in Unity to support different devices including VR & AR
navigation
MRTK already provides an input system for the simulator on PC and for Hololens 2. On the simulator, we can use the classical WASDQE keys to make movement of 6 degrees, like controlling a plane. We can press the right click button and drag the pointer to rotate. In order to click onto a button, we should rotate so that the central point is pointing at the button. After that, pressing the right click button of the pointer will trigger the actions set onto this virtual button.
interactions
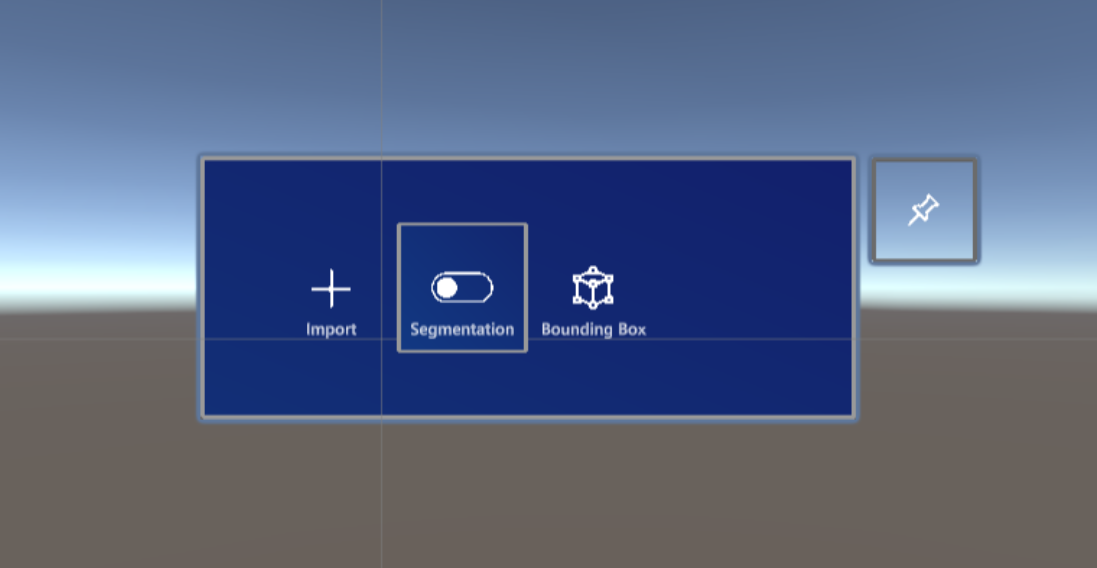
The first button is to import the brain data and make volume rendering onto it. We also created a Near-Hand Menu so that we can access the options no matter where we are in the scene. Each time before running, we will set the path to the directory of data. By pressing the button, the volume rendering plugin will work.
It is after importation that other options will be possible. We can continue to import the segmentation data on the same brain, which will render in red color the tumor, identified by doctors. Another option is to draw a bounding box, if the data has no segmentation part. The position and size of this bounding box is the result of the estimation using deep learning in python.
Data exchange between python and unity
In order to communicate between the deep learning result and Unity, we used JSON format. By definition, JSON is an open standard file format, and data interchange format, that uses human-readable text to store and transmit data objects. Here, we would like to pass the coordinates and size data of estimation.
Conclusion
The source code with dataset can be found here.
References
definition of volume rendering [point cloud importer for unity] (https://github.com/keijiro/Pcx) [k3d jupyter] (https://github.com/K3D-tools/K3D-jupyter) volume rendering in unity definition of JSON format